Manage System
Overview
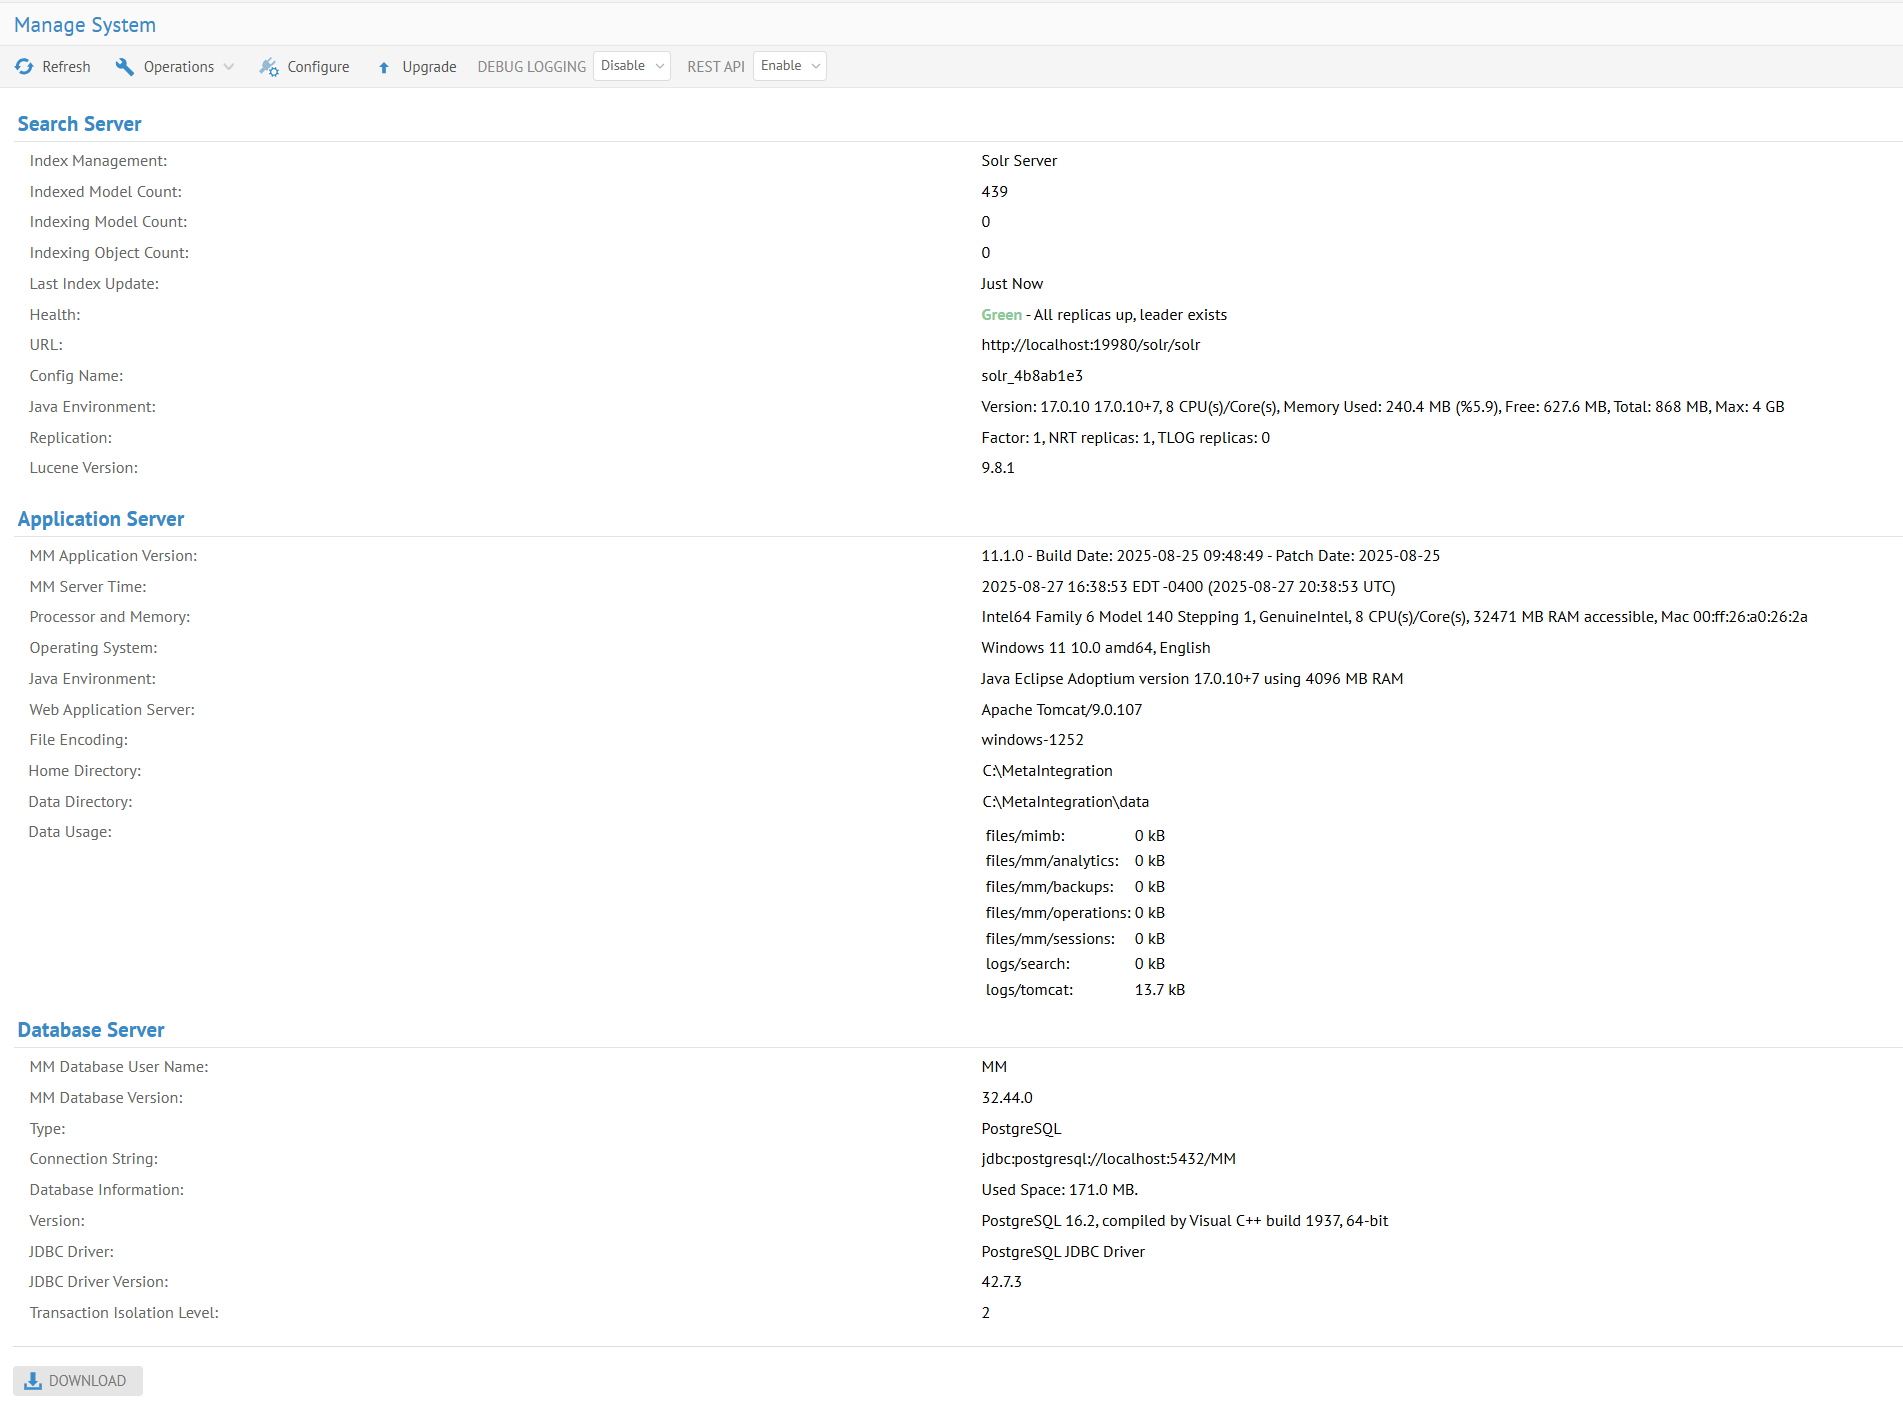
Each configuration is counted as an additional indexed model in the Indexed Model Count.
System Information
Manage > System presents the current system level information about:
-
The Search Server
-
The Application Server
-
The Database Server
You may click DOWNLOAD to obtain a text version of this information.
Search Server Information
Provides the total number of indexed models, the number of models and objects that are being indexed, and the last time the index was updated. Also provide information about the Solr server.
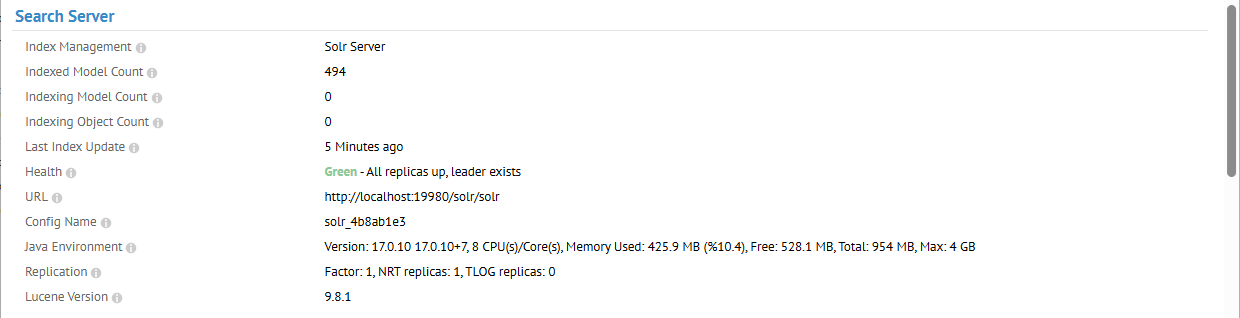
| Property | Definition |
|---|---|
| Index Management: | Name of the indexing server use for searching |
| Indexed Model Count: | Total number of models (including sub models) currently indexed |
| Indexing Model Count: | Current number of models (including sub models) currently being indexed |
| Indexing Object Count: | Current number of objects currently being indexed |
| Last Index Update: | Time since the last model required indexing |
| Health: | Status of the search engine |
| URL: | Active URL |
| Config Name: | Solr server index name |
| Java Environment: | Current stats of the JVM used by the search engine |
| Replication: | Replication information on the Solr index |
| Lucene Version: | Version of the indexing server |
Application Server Information
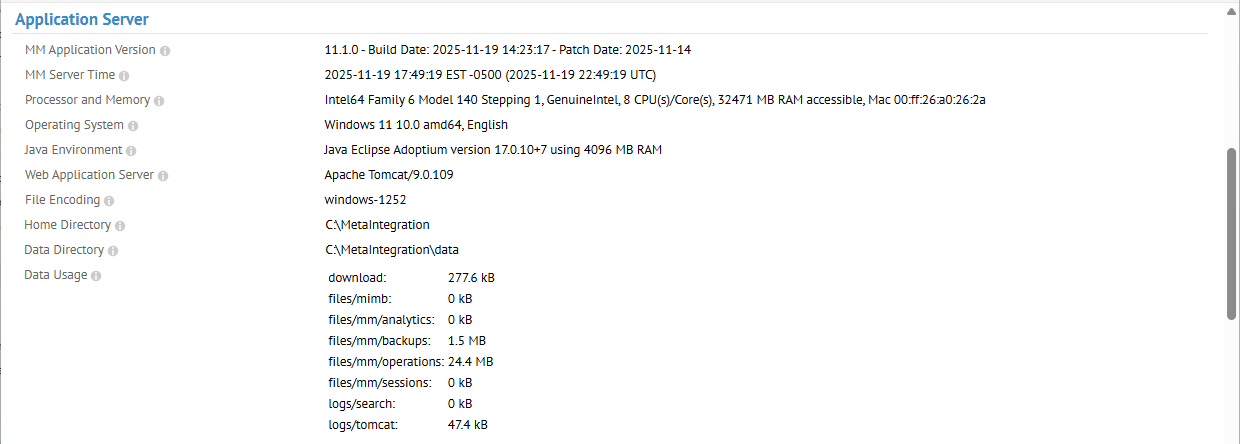
Provides information about the application server, including disk utilization for Windows environments.
| Property | Definition |
|---|---|
| MM Application Version: | Version, build date and patch date for the application server |
| MM Server Time: | Current time as recorded by the application server |
| Processor and Memory: | Hardware stats of the machine where the application server is running |
| Operating System: | Operating system stats of the machine where the application server is running |
| Java Environment: | JVM stats of the machine where the application server is running |
| Web Application Server: | Apache Tomcatstats of the machine where the application server is running |
| File Encoding: | File system encoding |
| Home Directory: | Currently assigned HOME_DIRECTORY used by the application server |
| Data Directory: | Currently assigned M_DATA_DIRECTORY used by the application server |
| Data Usage: | Current file system folder allocation sizes used by the application server |
The MM Server Time presents both the local time and (UTC), and is a convenient reference for validating times printed in logs (which are also based upon server time of the server where the bridge ran).
Database Server Information
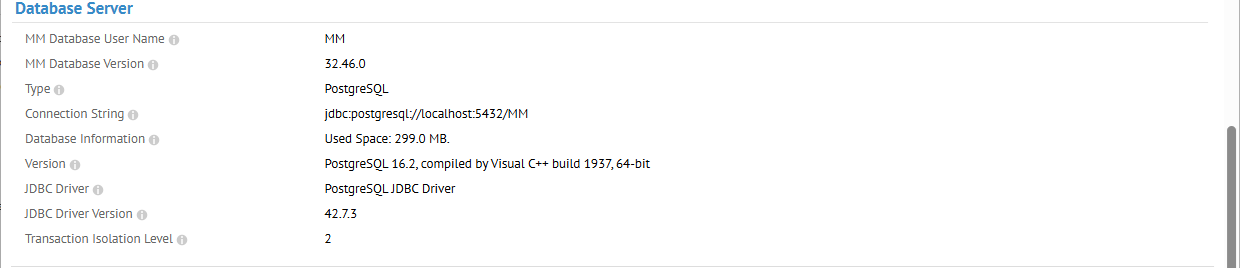
Provides information about the database server.
| Property | Definition |
|---|---|
| MM Database User Name: | Native authentication user name to the application server repository database |
| MM Database Version: | Application server based version of the repository database |
| Type: | Database type of the application server repository database |
| Connection String: | Connection string constructed for the application server repository database |
| Database Information: | Current size of the application server repository database |
| Version: | Full information describing the application server repository database |
| JDBC Driver: | JDBC driver use to connect the application server repository database |
| JDBC Driver Version: | Full version information for the application server repository database |
| Transaction Isolation Level: | JDBC transaction isolation level used by the application server repository database |
Analyze Statistics
Configuration Statistics
Simple, easy to read statistics report. To be used by any administrator wishing to obtain high level statistics for a given configuration.
You may review configuration access and lineage statistics.
Steps
-
Sign in as a user with at least the Application Administrator capability global role assignment.
-
Go to Manage > Statistics in the banner.
-
From here you may:
-
Specify the TYPE of statistics as either Configuration or Lineage
-
Restrict the view to a particular period of time into the past.
-
Example
Go to Manage > Statistics.

You have object statistics. This report is for a specific configuration (the current one at the time of execution). Thus, comparing it with the Repository Statistics report can be misleading.
Click Download.

You may download either CSV files or XLSX files. The XLSX file have special handling which safeguards against CSV Injection, also known as Formula Injection, which is a security vulnerability that occurs when untrusted input is included in a CSV file.
Go to the Search tab.

You have search statistics.
Repository Statistics
Simple, easy to read statistics report, to be used by any administrator wishing to obtain high level statistics on the repository model and features used.
Steps
-
Sign in as a user with at least the Application Administrator capability global role assignment.
-
Either:
-
Manage> System:
-
Go to Manage > System in the banner.
-
Go to Scripts > Get repository statistics.
-
-
Manage> Repository:
-
Go to Manage > Repository in the banner.
-
Right click on the Repository root and select Operations
Get repository statistics.
-
-
Click Run.
-
Open the log of the operation when complete.
-
Click (Download) Operation Files.
Example
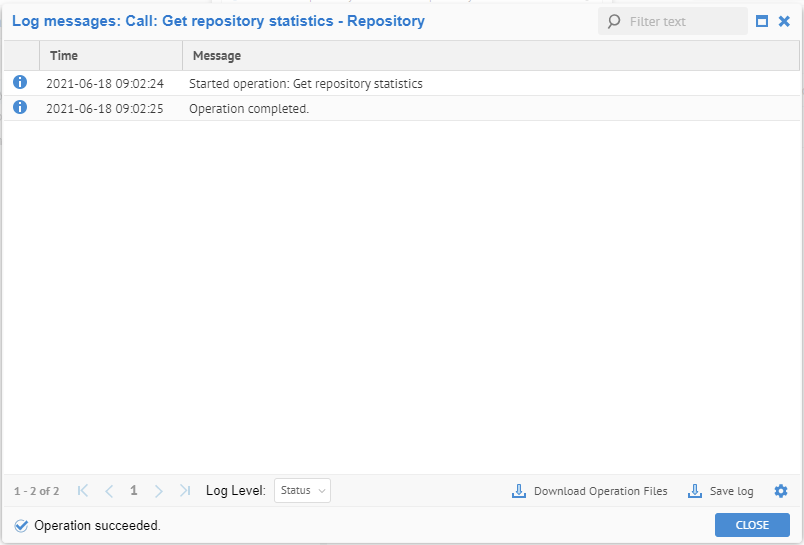
Sign in as Administrator. Go to Manage > System in the banner. Go to Operations > Get repository statistics. Click Run. Open the log of the operation when complete.
Click Download Operation Files.
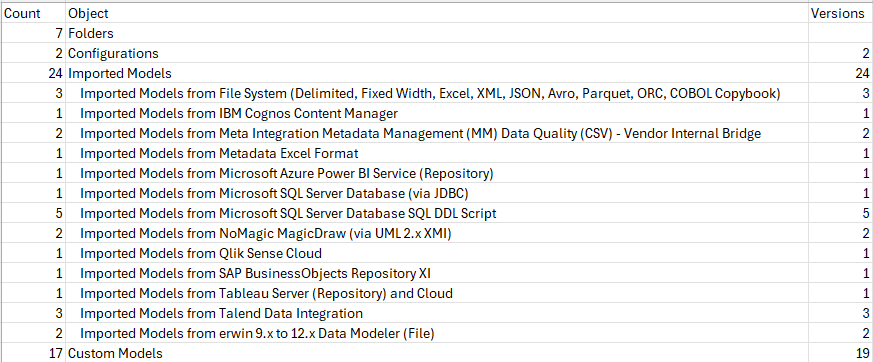
The count here is independent of number of versions. Thus, there are two configurations in this case, each with any number of versions.
In addition, "Naming Standards" is simply included in the Customer Models count, which is all the models based upon model types defined in Manage > Metamodels.
Repository Configuration Statistics
Simple, easy to read statistics report scoped to the models from the configuration perspective, to be used by any administrator wishing to obtain configuration level statistics on the all the configurations and their model.
Steps
-
Sign in as a user with at least the Application Administrator capability global role assignment.
-
Either:
-
Manage > System:
-
Go to Manage ** > System** in the banner.
-
Go to Scripts > Get repository configuration statistics.
-
-
Manage > Repository:
-
Go to Manage > Repository in the banner.
-
Right click on the Repository root and select Operations
Get repository configuration statistics.
-
-
Click Run.
-
Open the log of the operation when complete.
-
Click (Download) Operation Files.
Example
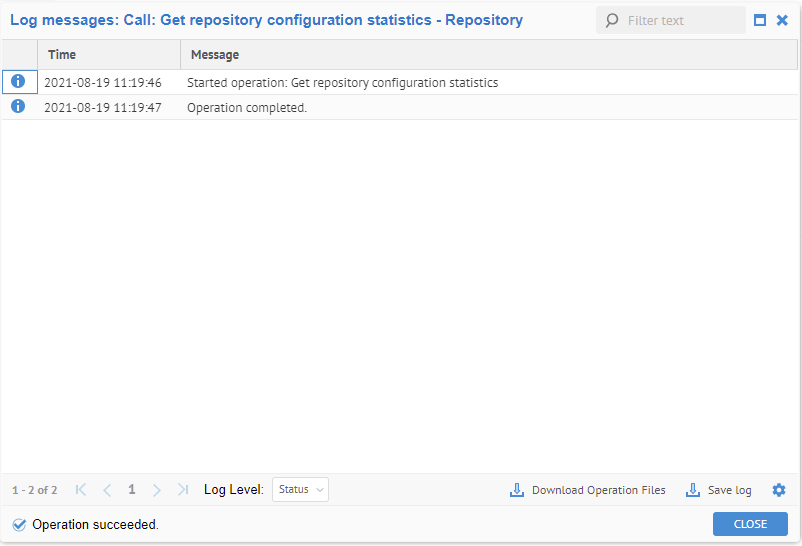
Sign in as Administrator. Go to Manage > System in the banner. Go to Scripts > Get repository configuration statistics. Click Run. Open the log of the operation when complete.
Click (Download) Operation Files.
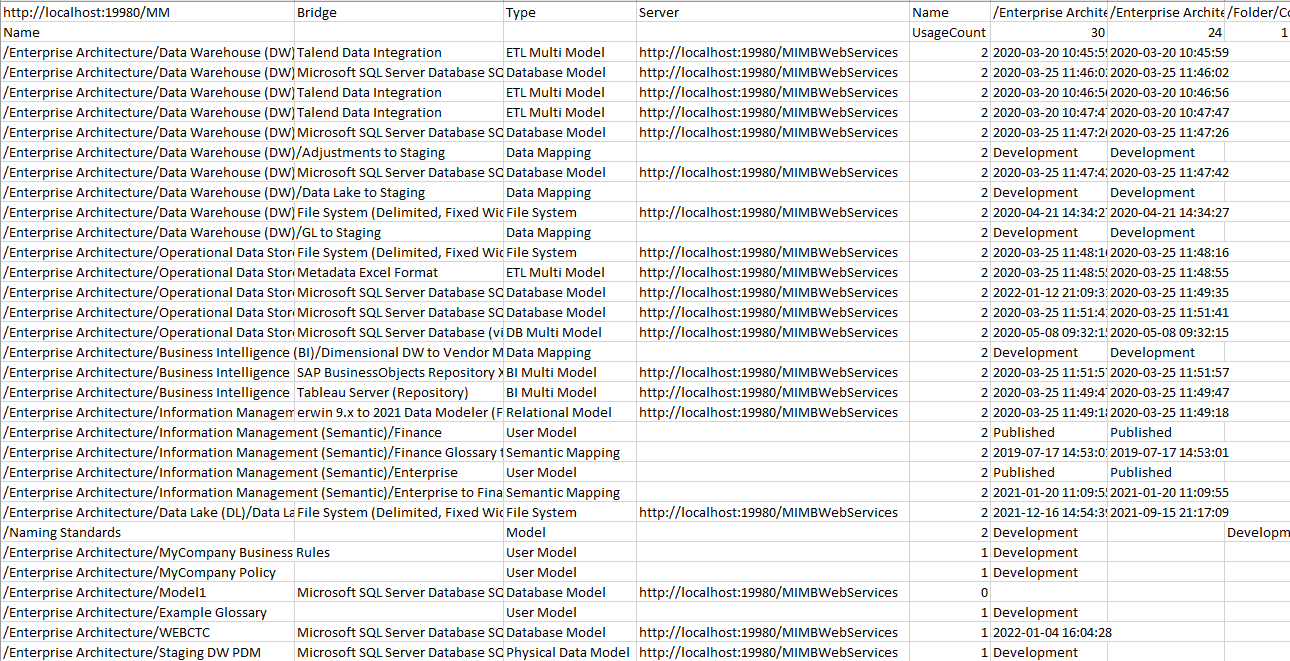
The A1 cell of the operation output file RepositoryConfigurationUsage.csv gives the parameter value of the =HYPERLINK function of other columns (starting from F1) . You can view a configuration architecture view by clicking on those columns. You need to provide your MM URL as the value of the A1 cell. By default the MM URL is http://localhost:19980/MM. If you are running on port 11580, you'll need to change the A1 value to http://localhost:11580/MM. Replace the host name accordingly if your host name is not localhost.
Starting from the 2nd row, the csv file shows a configuration level statistics of all models in the repository, their names, bridge types, model types, import server names, usage counts, in which configuration they are used etc.
System Statistics
To be used exclusively for support purposes debugging DB issues.
Steps
-
Sign in as a user with at least the Application Administrator capability global role assignment.
-
Either:
-
Manage > System:
-
Go to Manage > System in the banner.
-
Go to Scripts > Get system statistics.
-
-
Manage > Repository:
-
Go to Manage > Repository in the banner.
-
Right click on the Repository root and select Operations
Get system statistics.
-
-
Click Run.
-
Open the log of the operation when complete.
-
Click (Download) Operation Files.
Example
Sign in as Administrator. Go to Manage > System in the banner. Go to Scripts > Get repository content system statistics. Click Run. Open the log of the operation when complete.
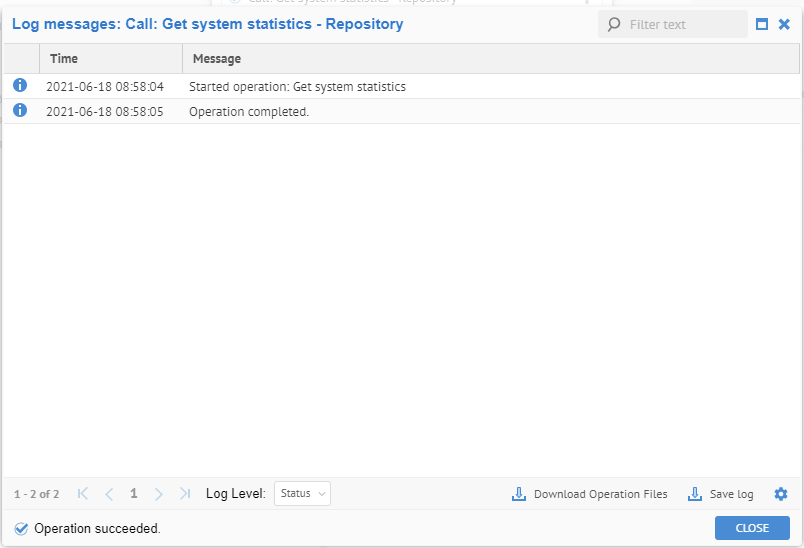
Click Download Operation Files.
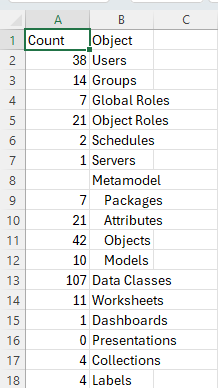
The Count of Users includes a system user which cannot be managed (and is not displayed) but is counted. Thus, while the Count here is 38 Users, in fact if you go to Manage > Users, you will only see 37.
Configuration and Repository Search Statistics
Simple, easy to read statistics report. To be used by any administrator wishing to obtain high level statistics on the repository object and features used.
Steps
-
Sign in as a user with at least the Application Administrator capability global role assignment.
-
Go to Manage > Repository in the banner.
-
Select either:
-
The Repository root
-
A configuration
-
Go to the Search Statistics tab
-
From here you may select
- The Period to present statistics for
i. 24 hours
ii. 7 days
iii. 30 days
iv. 6 months
v. Custom
-
Restrict to Searches with or without results.
-
Limit the number of different results.
-
The type of presentation with Dispaly As.
i. Grid
ii. Bar
iii. Pie
iv. Line
Example
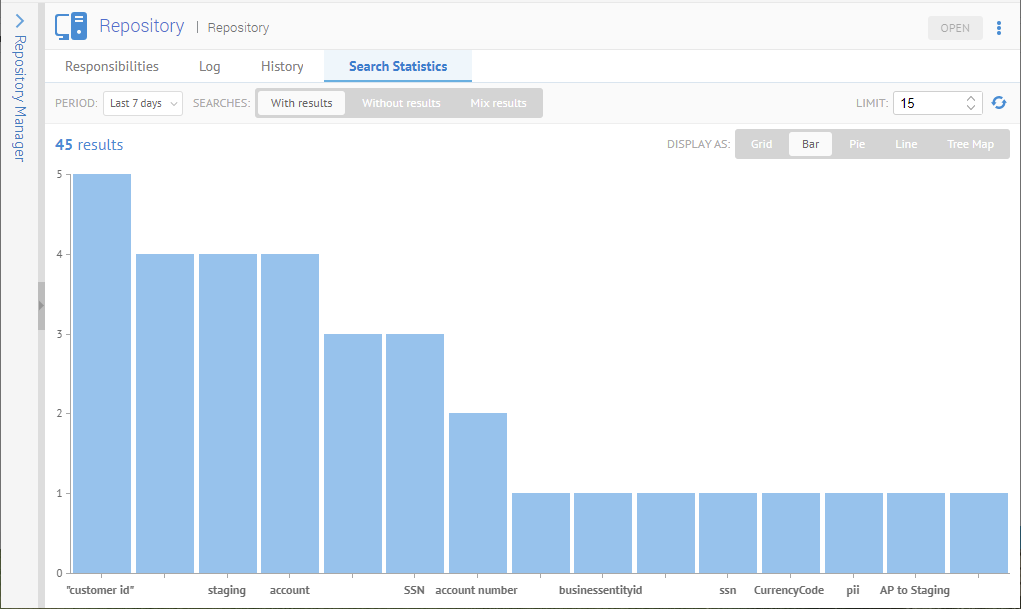
Sign in as Administrator, go to Manage > Repository, select the Repository root and go to the Search Statistics tab.
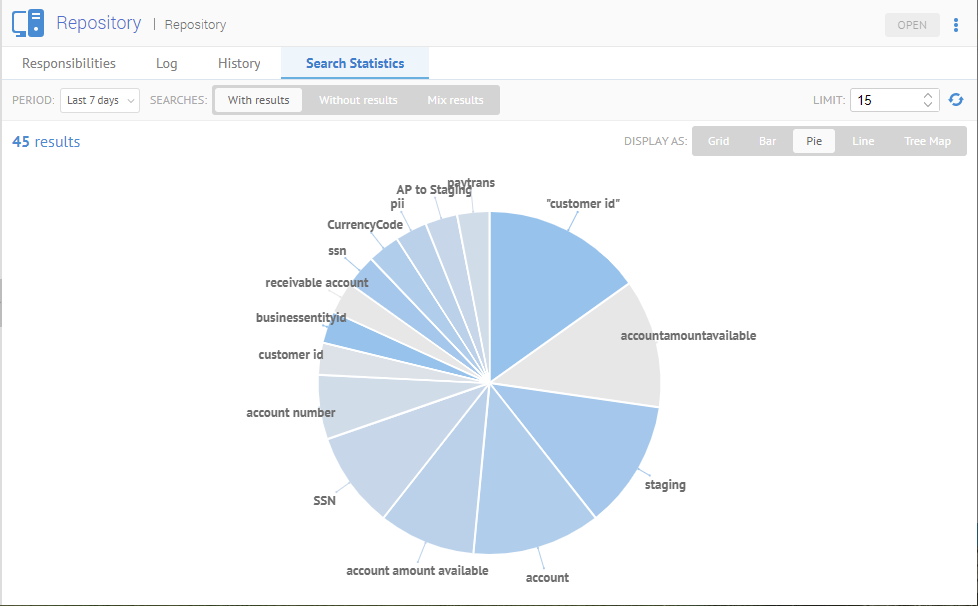
Click on Pie.
Run Performance Script
The performance script allows you to assess the relative performance of your system.
Steps
-
Sign in as a user with at least the Application Administrator capability global role assignment.
-
Go to Manage > System in the banner.
-
Click on Operations > Test Performance.
Example
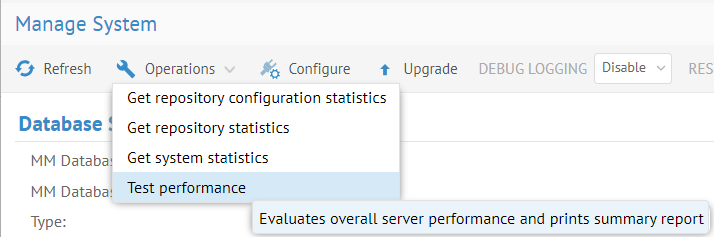
Then, Save the log from the operation and the results are in the log:
[42/Test performance] 2023-10-06 13:14:01 OPER_S0210 MIR server
version: 11.1.0 build date: 2023-10-03 17:18:42.
[42/Test performance] 2023-10-06 13:14:01 OPER_S0210 Creating the MIR
XMI model external content....
[42/Import model version from XMI fi] 2023-10-06 13:14:01 OPERI_S0002
Started operation: Import model version from XMI file
[42/Import model version from XMI fi] 2023-10-06 13:14:01 OPER_S0147
Skipping checksum comparison: a new version will be created even if the
content did not change.
[42/Import model version from XMI fi] 2023-10-06 13:14:02 OPER_S0010
Storing imported model to repository at: [-1,1667]
[42/Import model version from XMI fi] 2023-10-06 13:14:02 REPO_I0067
Profiling the model: Version [[-1,1667]], model name []orcl]
[42/Test performance] 2023-10-06 13:14:15 OPER_S0210 Searching in the
MIR XMI model... took 0 secs..
[42/Test performance] 2023-10-06 13:14:15 OPER_S0210 Tesing
performance for the MIR XMI model... took 3 secs..
Configure Database Connection
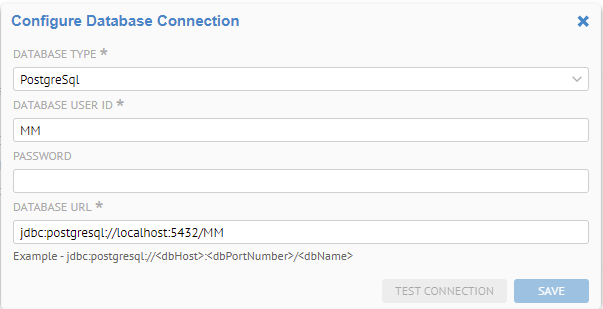
You may configure the connection to the repository database here.
Steps
-
Sign in as a user with at least the Application Administrator capability global role assignment.
-
Go to Manage > System in the banner.
-
Click Configure.
Enable/disable debug logging
You may turn on debug level logging in order to better diagnose issues you may see reported in the logs or to display internal.
This setting applies to all subsequent actions which produce logs, whether manually invoked or scheduled. It also means that debug messages will appear in the Tomcat logs.
Debug logging is VERY verbose. Thus, be sure to turn off (Disabled) debug level logging as soon as you have captured your diagnostics. In addition, the debug logging is reset to Disabled when you restart the application server.
Debug level messages are not shown Manage > System Log, nor is it part of the download there. Instead, when you enable debug logging, those messages are written to the Tomcat server logs on the application server machine. You may find these in the installation directory at
/data/logs/tomcat/
Setting debug level logging also affect the attributes shown on the object page and also the Properties panel, showing additional information like Object Id and Stable ID. Other internal information like Lineage Options which are only for internal debugging purposes also will appear. Thus, debug logging should be disabled unless absolutely required.
Steps
-
Sign in as a user with at least the Application Administrator capability global role assignment.
-
Go to Manage > System in the banner.
-
Select Enable/Disable in the DEBUG LOGGING pull-down.
Example

Enable/disable REST API
MetaKarta provides direct REST API call access.
You may enable this capability in Manage > System.
To prevent possible security vulnerabilities associated with this type of API, it is disabled by default. In addition, an interactive environment is provided to try out any API methods directly, but again it is disable by default. You must enable these as part of the setup procedures.
More details may be found in the deployment guide.
To go to the interactive Rest API environment to try out any API methods, select REST API from the avatar in the upper right corner of the any page.
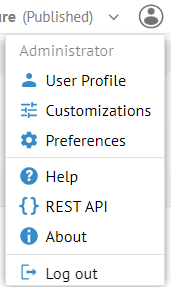
Steps
-
Sign in as a user with at least the Application Administrator capability global role assignment.
-
Go to Manage > System in the banner.
-
Select Enable/Disable in the REST API pull-down.
Upgrade
The Upgrade operation allows you to apply a software patch to the server from the UI. Each patch is in the ZIP format and is a collection of files and directories organized in the same manner as the home directory of the application server.
The most critical patches are officially delivered as cumulative patches.
You should inspect the currently running Operations and either let them finish or STOP them before the upgrade.
You may disable all schedules without deleting them by selecting the schedules you wish to set in the list and right-clicking.
MIMM Cumulative Patch Upgrade
Contains patches for the application server and UI, in the format:
They are delivered in the patch ZIP file in the path tomcat/webapps. These cumulative patches include an updated MM.war file which will be automatically deployed by the Tomcat web application server once there are no active operations (e.g., database maintenance or model import).
However, the above upgrade process will NOT wait for all users to be logged out.
The date displayed is the date of from the $MM_HOME/tomcat/webapps/MM.war which can be slightly older than the MetaKarta cumulative patch if that patch did not provide and updated .war file.
While Tomcat is re-deploying the new .war file, users may temporarily experience this error message:
Request to the server failed.
Some MetaKarta patches will cause a database upgrade to be required. If so, you must sign in and then the log of that database upgrade is presented.
If you wish to see an older database upgrade log, it can be retrieved from the log files in the $MM_HOME/data/logs/tomcat folder.
Steps
-
Sign in as a user with at least the Application Administrator capability global role assignment.
-
Go to Manage > System in the banner.
-
Click on Upgrade.
-
Browse for the patch package.
If you cannot find the location using the Browse function you must configure (as part of the installation) the available paths to present to users. More details may be found in the deployment guide.
- Click Upgrade.
Example
Sign in as Administrator and go to Manage> System.
Click on Upgrade.
Browse for the patch package.
If you cannot find the location using the Browse function you must configure (as part of the installation) the available paths to present to users. More details may be found in the deployment guide.
Click Upgrade.
Customization
Contains look & Feel customization, e.g., for the logo and banner of the application server. They are delivered in the patch ZIP file in the path conf/resources.
Use the same upgrade process as for the MetaKarta cumulative patches.
Steps
-
Sign in as a user with at least the Application Administrator capability global role assignment.
-
Go to Manage > System in the banner.
-
Click Upgrade.
-
Browse for the patch file (.ZIP) to apply.
If you cannot find the location using the Browse function you must configure (as part of the installation) the available paths to present to users. More details may be found in the deployment guide.